Data-driven decisions are the backbone of modern online businesses. As too many learn, however, the only thing worse than not using your data is using it incorrectly. Here are five mistakes that we’ve seen companies make (before getting their ecommerce analytics on the right track with RJMetrics).
1. Not Accounting for Age
Aggregate analysis of customer behavior can be extremely misleading. For example, consider a company that has acquired customers through Google Ads for years, but only recently started spending money on Sponsored Tweets. An analysis of “customer lifetime spending by acquisition source” would likely show that Google-acquired customers, on average, have spent more than Twitter-acquired customers. But, this doesn’t mean that Twitter is an inferior source of leads—it’s just a misleading way of slicing the data. Of course the average Google customer has spent more: they have been a customer for a longer amount of time and had more opportunities to make repeat purchases.
This is an extremely basic example, but variations on this oversight lead to a surprising amount of confusion in companies of all sizes. To avoid this problem, use cohort analysis to segment customers by common attributes like when they made their first purchase. This allows for apples-to-apples comparisons of customer cohorts that can then be expanded into more insightful and actionable analyses.
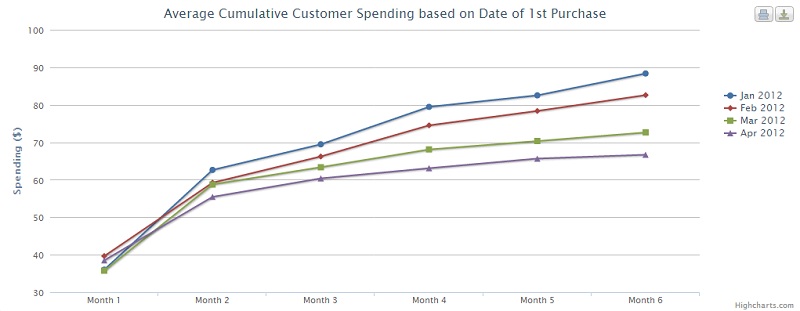
A sample cohort analysis
2. Not Planning Next Steps
Before you invest time in running an experiment or conducting an analysis, it’s important to understand how the results will impact your behavior. There will always be countless ways to slice and dice your data, and the best way to avoid analysis paralysis is to focus on metrics that will drive you to act.
To determine if a metric is actionable, simply consider the possible results of your analysis and ask yourself how your strategy or behavior will change based on the results. If it won’t, maybe your time would be better spent elsewhere.
3. Ignoring Test Significance
Whether you’re running an A/B test or performing ad hoc analysis on your data, remember that the sample size of your data set is key to the significance of your analysis (i.e., how likely it is that your observation is representative of the total population).
Many tests are not worth running, and you can save lots of time being realistic about when data may or may not hold the answers. Sites like test significance can help you determine how costly a given test might be and what it takes to reach significance.
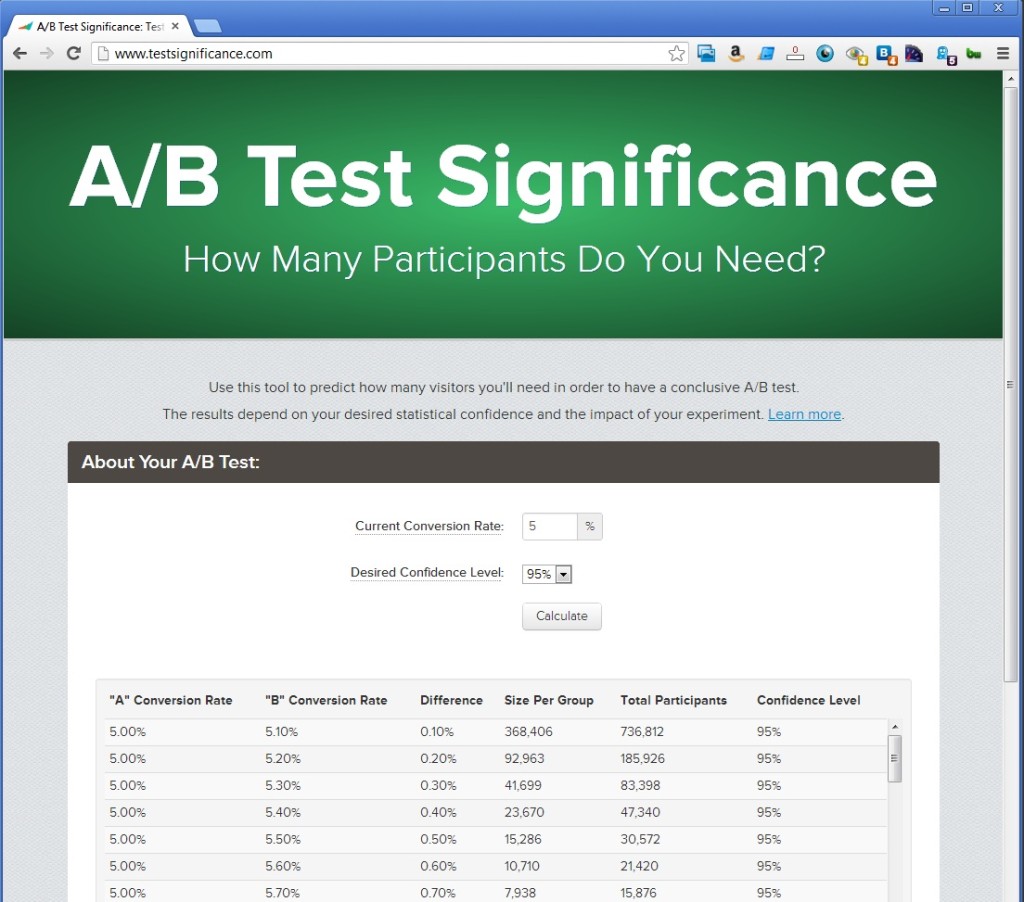
Online Test Significance Tool
4. Stopping at the Surface
Imagine that a company is studying which referral sources yield the most valuable customers. If they find that one source is superior, they have discovered a correlation between referral source and Customer Lifetime Value (CLV). However, this does not mean that referral source is causing CLV to be higher for those customers—all it means is that they are linked.
Unseen “lingering” variables could be the true reason for the correlation. Perhaps your online store is not well optimized for a female audience and the best-performing referral source is simply the one that refers you the highest percentage of male shoppers. In this case, blindly shifting all of your spend to that referral source could backfire if their demographics shift.
The smarter move would be to redesign your homepage, which would lift CLV across all channels. The only way to discover this opportunity, however, is to dig deeper within your data. Look at all of the characteristics of your customers – not just the ones tied directly to marketing spend – and you may discover far more meaningful metrics to act upon.
5. Modeling Growth Projections By Percentage
I worked in venture capital prior to starting RJMetrics, and I quickly learned that most company financial models (which forecast future growth) are exercises in fantasy. One of the main reasons is that so many models are driven by inputs like “percentage growth per month.” In these models, a slight change in that parameter can be the difference between a billion-dollar company and a dud.
This blanket “percentage growth” methodology says nothing about what’s driving that growth or what such growth actually means in terms of the number of customers added, where they came from, and how they were monetized.
Rather than an exercise in fantasy, make it a model that demonstrates the fundamental economics of scaling your business. Build a “bottom-up” model by using more granular inputs that are specific to your business model. This will lead to a more productive conversation and help set you apart from the pack.
Pingback: Geek Reading February 6, 2013 | Regular Geek
Pingback: The Daily Six Pack: February 8, 2013 | Dirk Strauss
Pingback: Marketing Day: February 8, 2013