Note: This post originally appeared as a guest feature on TechCruch to announce our new Test Significance website.
At RJMetrics, we believe in data-driven decisions and that means we do a lot of testing. However, one of the most important lessons we’ve learned is this: not all tests are worth running.
In a data-driven organization, it’s very tempting to say things like “let’s settle this argument about changing the button font with an A/B test!” Yes, you certainly could do that. And you would likely (eventually) declare a winner. However, you will also have squandered precious resources in search of the answer to a bike shed question. Testing is good, but not all tests are. Conserve your resources. Stop running stupid tests.
The reason for this comes from how statistical confidence is calculated. The formulas that govern confidence in hypothesis testing reveal an important truth:
Tests where a larger change is observed require a smaller sample size to reach statistical significance.
(If you’d like to dig into why this is the case, a good place to start is Wikipedia’s articles on hypothesis testing and the binomial distribution.)
In other words, the bigger the impact of your change, the sooner you can be confident that the change is not just statistical noise. This is intuitive but often ignored. And the implications for early-stage companies are tremendous.
If your site has millions of visitors per month, this isn’t a big deal. You have enough traffic to hyper-optimize and test hundreds of small changes per month. But what if, like most start-ups, you only have a few thousand visitors per month? In these cases, testing small changes can invoke a form of analysis paralysis that prevents you from acting quickly.
Consider a site that has 10,000 visitors per month and has a 5.0% conversion rate. The table below shows how long it will take to run a “conclusive” test (95% confidence) based on how much the change impacts conversion rate.
| Starting Conversion Rate |
New Conversion Rate |
Total Participants Required |
Test Duration Required |
| 5.00% | 5.20% | 185,926 | 1.5 years |
| 5.00% | 5.40% | 47,340 | 5 months |
| 5.00% | 5.60% | 21,420 | 2 months |
| 5.00% | 5.80% | 12,262 | 37 days |
| 5.00% | 6.00% | 7,982 | 24 days |
| 5.00% | 6.20% | 5,638 | 17 days |
| 5.00% | 6.40% | 4,210 | 12 days |
| 5.00% | 6.60% | 3,276 | 10 days |
| 5.00% | 6.80% | 2,630 | 8 days |
| 5.00% | 6.90% | 2,378 | 7 days |
| 5.00% | 7.00% | 2,162 | 6.5 days |
| 5.00% | 7.20% | 1,814 | 5.4 days |
| 5.00% | 7.40% | 1,548 | 4.6 days |
| 5.00% | 7.60% | 1,338 | 4.0 days |
| 5.00% | 7.80% | 1,170 | 3.5 days |
| 5.00% | 8.00% | 1,034 | 3.1 days |
(Data assumes a Bernoulli Trial experiment with a two-tailed hypothesis test and all traffic being split 50/50 between the test groups.)
As you can see, your visitors are precious assets. Too many start-ups will run that “button font” test, expecting full well that in a best-case scenario it will only impact conversion by a quarter of a percent. What they don’t appreciate up-front is that this may block their ability to run certain other tests for a year and a half (assuming they don’t end the test prematurely).
When you can’t run many tests, you should test big bets. A homepage redesign. A pricing change. A new “company voice” throughout your copy. Not only will these tests potentially have a bigger impact, you’ll have confidence sooner if they do.
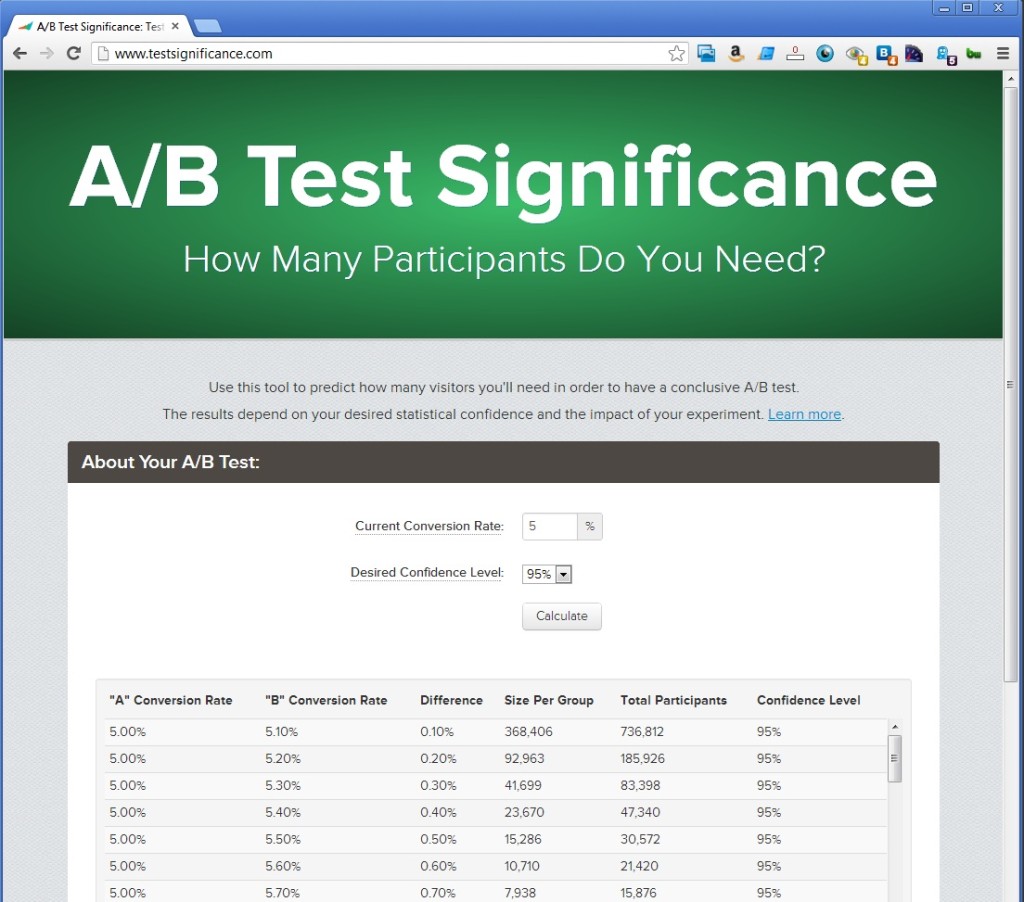
I found myself making this argument a lot recently here at RJMetrics, so I developed a tool to calculate the required population size for a significant test. We’ve shared that tool with the world free of charge at Test Significance. Just input your current conversion rate and your desired confidence interval and it will generate a table like the one above.
We hope this tool helps a few companies out there learn the lessons we have about when to test and what to expect in terms of finding a conclusive result.