This post is a teaser for a workshop webinar that the Magento Business Intelligence team is airing on May 25, 2017 @ 1 PM. Are you a marketer or an analyst who is interested in making insightful, data-driven decisions? Register here!
Imagine that you’re the chief marketing officer of an e-commerce apparel business that has accumulated $10,000,000 in gross merchandise value (GMV) over a 4-year life span. You use the Magento Enterprise platform to sell your flagship product line – locally-sourced wool sweaters – direct to consumers through your website, but your B2C business line is growing quickly. Sales have grown by 30% every year, and all of your marketing efforts are focused on maximizing that top-line sales number, like:
- Encouraging repeat revenue
- Reducing customer churn
- Maximizing average lifetime value (LTV)
Average LTV, in our experience, is a valuable metric to understand and to optimize. It’s very easy to digest in a sentence: “The average customer, in their first 6 months, has an LTV of $150, and this grows to $206.00 across the customer’s life.” But to your specific business – is the rolled-up average masking some important insights? By using the data that you own today, we can dig deeper into how accurate, or inaccurate, statements like these can be.
The 80/20 rule (or more)
There’s an anecdote that we hear a lot in the analytics space, which always sounds something like: “20 percent of my customers represent 80 percent of my sales”. This is actually a technical concept in economics, called the Pareto principle. The 80 and 20 are anecdotal – your business, of course, probably has a different distribution. But the idea is that for many situations in nature and business, a large share of the effects come from a small share of the causes. In your business, the causes are your customers, and the effect is sales or revenue.
The LTV of your customers, then, follows a power law distribution and is highly unequal. Using a BI tool like Magento Business Intelligence, you can determine what your customer concentration is – your version of the 80/20 rule.
Outliers (and identifying the whales)
Another way to phrase that rule, though, is to compare the top 20%, or 1%, to the bottom X%. Suppose your apparel business has 50,000 customers that have contributed that $10M in all-time GMV. Your top 1% of customers, you find, contributed $2,500,000 to that $10M total. That top percent are the whales in your book. It’s important, though, to think about these terms in the context of your smallest customers as well. When you understand that customer concentration, you can interpret it with a sentence like this:
- My top 500 (1%) customers contributed the same amount of sales as my bottom 20,000 (40%) customers.
This level of inequality in your customer base is the reason that a simple average LTV is actually an incomplete way of understanding customer activity.
What’s the LTV for that top 1%?
Using a distribution of percentiles to look at LTV can be much for valuable than taking the average or the median. We plugged our simulated e-commerce dataset into Magento BI to display how the platform illustrated that LTV distribution across the top 20% of customers by LTV. Recall that of the entire customer population, the average LTV was $206. It looked like this:
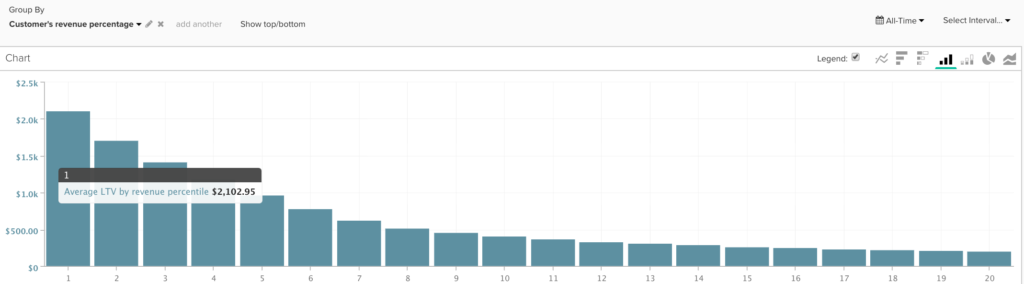
Our simulation (and yes, it is a simulation) often parallels reality for the clients we work with. Your top 1% of customers might be 10x more valuable than the average customer. Anyone in the top 20% could at least twice as valuable than the average customer. And it’s easy to use Magento Business Intelligence to set up this type of reporting on your own dataset, to enable your own data-driven decision-making.
Turning insights into action
So, what can you do with this information? The patterns you uncover in your data are only as valuable as your ability to transform them into an actionable strategy to maximize revenue and LTV. In our e-commerce apparel business’s example, given that business’s goals, we might consider the following actions:
- Identify common traits among top customers (and bottom customers), and market to those similar to the top X%. Are certain products creating loyalty among the top customers? Is a certain geo- or age-based demographic more represented in the 1%/10%/20%? Develop a marketing campaign based on attracting, and retaining, customers like this.
- Stop spending money on acquiring low-ROI customers. The cost to acquire a customer should be considered an input to LTV — and should be thought of differently for high-value and low-value customers. If the LTV of your low-value customers isn’t worth the investment you’re giving it, you should spend that money somewhere else.
In short — every business is different, but a member of strategies can be derived from understanding just how high-value your top customers are. Do you want to understand these strategies in more detail? Please join our team for a webinar workshop on customer concentration next Thursday, May 25, at 1 PM ET. Register here!