The top 1% of your customers spend 30x more than your average customers. If you drew a line dividing customers into the top and bottom half — one of your very best customers will spend more than everyone below the line added together. With every ad campaign, you want to acquire someone who will become one of these big shoppers.
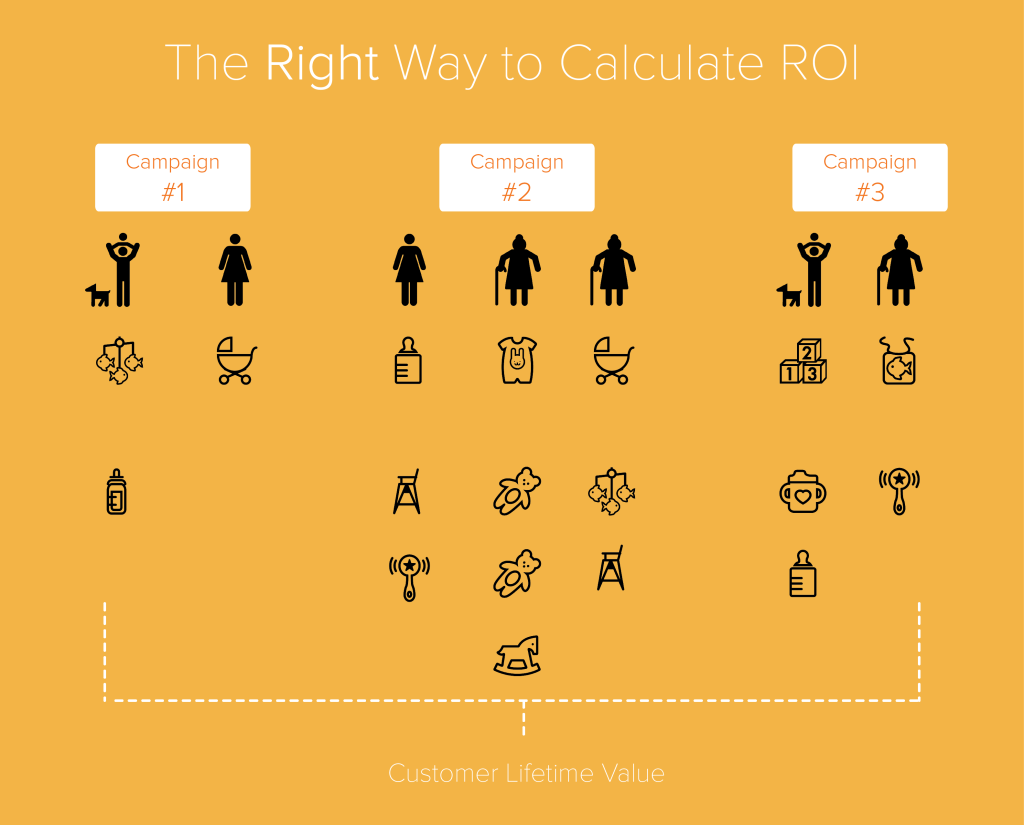
To find the campaigns which net the best ROI, you need to know which campaigns are attracting the most profitable customers. In other words, people with high Customer Lifetime Value. CLV is the single most important metric you have to evaluate marketing performance. It’s defined as the sum of all the purchases a customer makes with you. By incorporating this metric into your ROI calculations, you’ll find the campaigns that help you acquire your most profitable customers.
Why your ROI calculations might be wrong
The traditional ROI formula isn’t good enough because it measures revenue based on first transaction alone.
ROI = (dollars in revenue)/(dollars spent) – 1
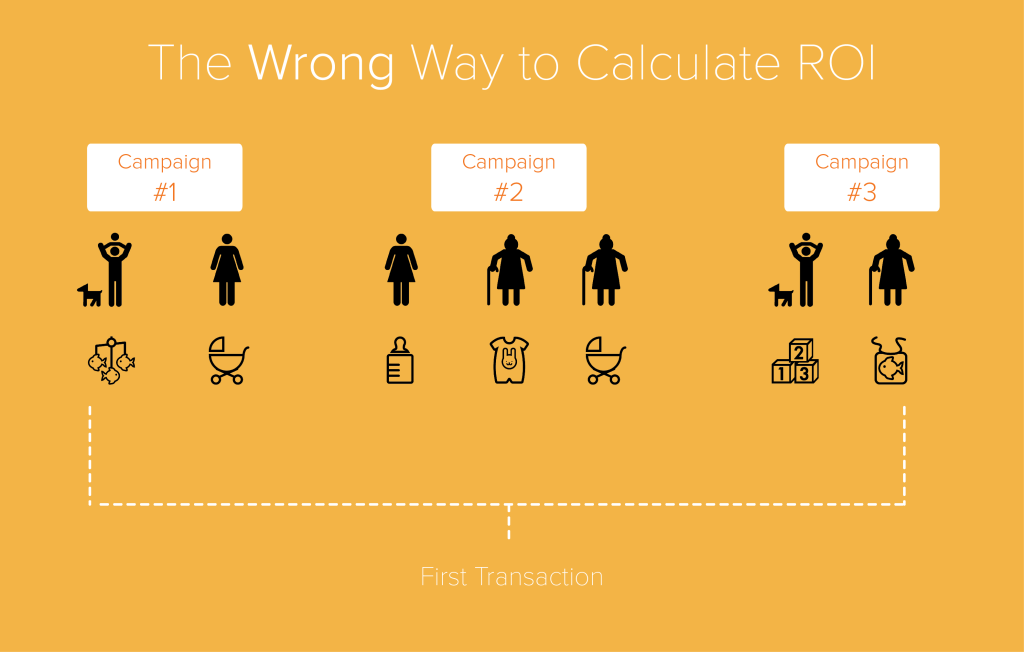
These figures don’t incorporate the full purchase history of customers acquired through each campaign. This makes it impossible to tell which campaign is bringing in your most profitable customers. You want your ROI calculations to include the full Lifetime Value of customers.
A Step-by-Step Guide on Calculating ROI the Right Way
Fire up your spreadsheet and get ready to calculate ROI the right way.
1. Grab the information you’ll need
Ad Spend Data by Campaign: Most ad platforms give you the ability to export data on campaign performance and spend. Unfortunately, you’ll have to download each report separately and combine them by hand if you use multiple ad platforms.
Order Data: You order data is likely sitting in the same source as your customer data. Make sure you can get your hands on it and that it includes order amount and order date.
Customer Data: (including customer acquisition source and campaign) You probably have access to your customer data; you’ll also need to know the acquisition source for each of them.
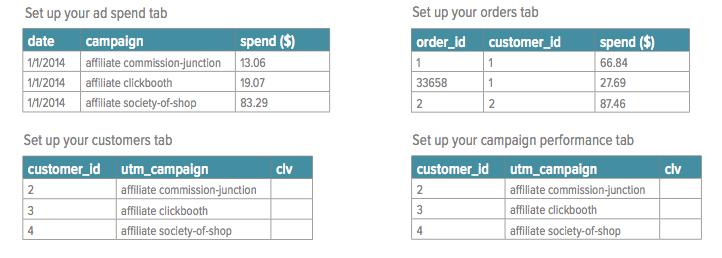
2. Organize your spreadsheet
You’ll want to set up four tabs in your spreadsheet. The first will include your ad spend data, the second will include customer data, the third will be orders data, and the fourth will be where you’ll conduct your ROI calculations. Here is how each of these tabs should look:
3. Calculate CLV for each customer
In the customers tab use this SUMIF statement to calculate the CLV for each of your customers
=sumif(orders!$B$2:$B$1001,A2,orders!$C$2:$C$1001)
4. Calculate spend for each campaign
In your campaign performance tab use this SUMIF statement to calculate spend for each campaign
=sumif(‘ad spend’!$B$2:$B$121,A2,’ad spend’!$C$2:$C$121)
5. Calculate CLV by campaign
In your campaign performance tab use this SUMIF statement to calculate spend for each campaign
=sumif(customers!$B$2:$B$29,A2,customers!$C$2:$C$29)
6. Calculate ROI for each campaign
Now comes the fun part. In your campaign performance tab, use this formula to calculate ROI for each campaign
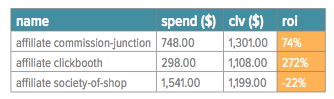
= (C2-B2)/B2
The Results
With this data, you can allocate your marketing budget with confidence. You’ll know that the money you spend won’t just be bringing in one-time buyers, but lifetime customers.
Of course, it is a bit more work. Running these calculations in a spreadsheet every month, or every week takes a bit of time. The good news is there are other data tools available to you then just your trusty old spreadsheet. Our clients use RJMetrics to automatically connect data on spend with customer order data. Ready to give it a try for yourself?