Americans now spend more time interacting with their smartphones than watching TV. And when people are watching TV, there’s a growing tendency to do so with a device in hand. 41% of all screen time is now multi-screen. Finally, and most importantly, the mobile market is growing. By the end of 2014, mobile commerce is expected to be a $114 Billion market.
It’s an exciting opportunity, but one that most ecommerce companies are under-investing in. And when you look at the data, it’s easy to see why. Mobile site traffic consistently has low conversion rates, and desktop has historically generated the lion’s share of revenue. It’s only natural that companies spend most of their time where they get most of their revenue.
But as consumer share of attention shifts heavily towards mobile, this isn’t a great long-term approach. The past 15 years have seen a wave of brick-and-mortar stores put out of business by ecommerce; make sure that you don’t get left in the dust as buying habits change again.
Fortunately, as in all things, you can let your data lead the way. In this post, we’ll examine how you can break into mobile using your data.
Three Different Customer Experiences
When examining customer behavior by platform, there are actually three, not two, experiences you need to look at:
- Desktop. This is your basic on-site experience delivered via a browser to users on their computers.
- Mobile web. You may have a completely separate mobile version of your website, a responsive version of your desktop site, or visitors may just be looking at your desktop site on a mobile device. Whichever experience you’re offering, it’s happening on a mobile device in a browser.
- Mobile app. You may or may not have a mobile app. If you do, visitors likely have a significantly different experience here than in your mobile website. Make sure you can segment these visits from the rest of your mobile traffic.
When running through the exercise below you’ll need to be able to segment your data by these three types of visitors. Make sure you have your web and commerce analytics set up to do this before you get started. (Let us know if you need help.)
Measuring Your Mobile Opportunity
Step 1: Count the visitors
Even if you’re not earning a huge portion of your revenue from mobile currently, it likely generates a sizeable chunk of your traffic. Your annual visits represents the current size of your mobile opportunity.
If you could create a mobile experience that converted at the same rate and order value as your desktop, what would that traffic be worth? If you could increase average order value by even a dollar or two, how would that change your bottom line?
Step 2: Add up your revenue
Before you get started on optimization, you want a good sense on where things stand currently. Add up the annual revenue you’re earning on your mobile website and mobile app. How does that compare with desktop?
Most companies will find that desktop revenue still dwarves mobile revenue. At this stage, that’s not a problem—we’re just collecting some data to get a sense of present and future opportunity.
Step 3: Measure your revenue per visitor
If you have 100 visitors and 4 of them purchase with an average order value of $35, your average revenue per visitor is $1.40 (4 * 35 / 100). Find this number for each of your three channels. Likely, your desktop visitors are the highest of the three.
Typically, the main hurdle to mobile monetization is conversion rate. Visitors on mobile websites simply don’t buy at the rate that desktop visitors do. But mobile conversion rates are increasing, and with a strong CRO campaign you could definitely improve yours.
Step 4: Calculate the opportunity
You’ve spent years optimizing your desktop experience, and have likely spent less time on mobile. But what if you put in the same level of effort? Using the numbers you just collected, let’s do a quick back-of-the-envelope calculation to get a sense for the revenue opportunity if you were to invest more focus on the mobile experience.
Here’s a simple calculator we built for you to try this. Just make a copy and enter your own numbers.
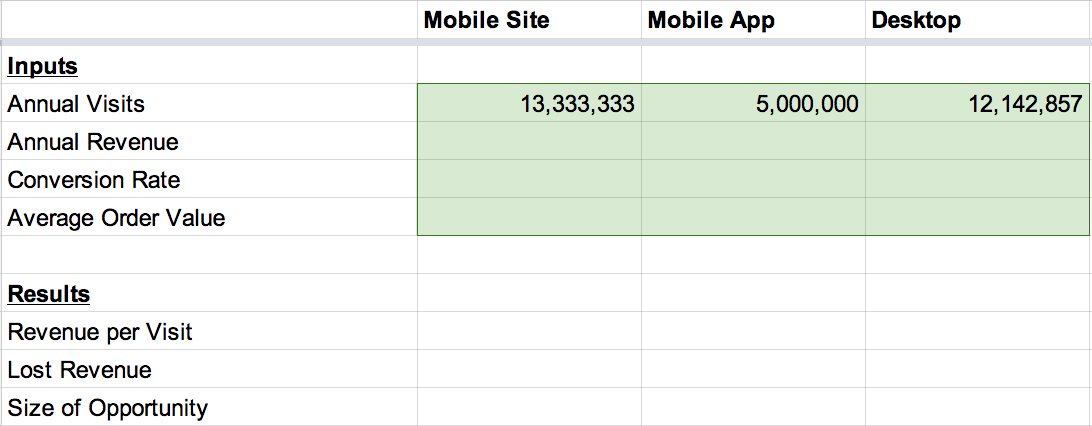
Enter your visitor counts for the past year:
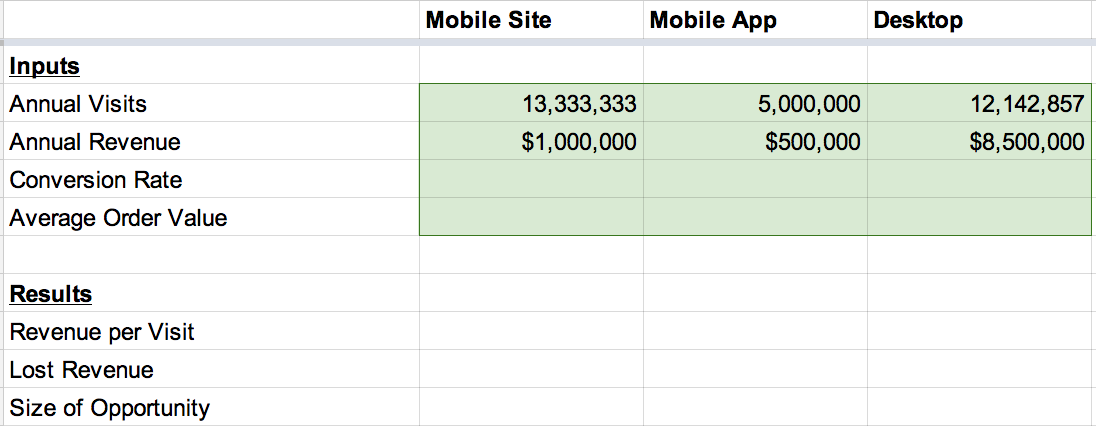
Second, enter your annual revenue totals by channel:
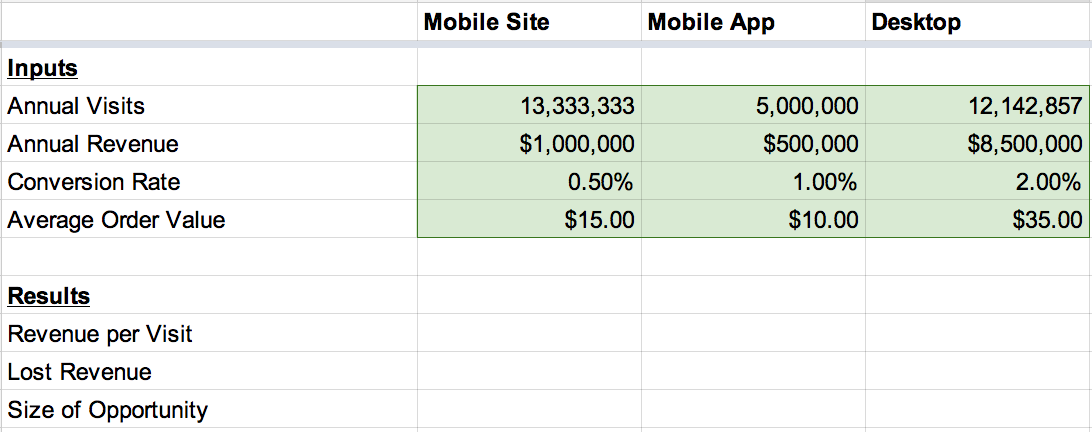
Third, add your average conversion rate and Average Order Value:
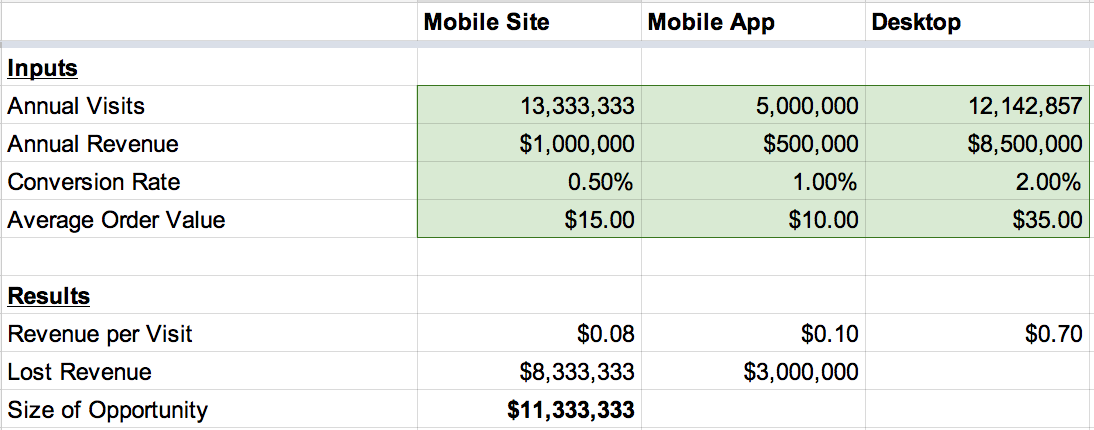
Check out the size of that opportunity:
What’s Next?
These basic numbers are a rough indication of how much revenue you’re missing out on from mobile. And that’s just today. Broader trends indicate that mobile’s impact will only increase in the coming years. If you’re missing a big opportunity today, it’s only going to get bigger.
Conversion rate optimization is central to your efforts in improving your mobile revenue. A/B testing tools like Optimizely and Artisan Mobile are the first step in improving mobile conversion rates.
Supplement testing data with what you know from your broader data sets. For example, 66% of emails are now being read on a mobile device. Are you optimizing your emails for mobile? Are your emails redirecting to your mobile app or your mobile website? Facebook’s new deep linking technology allows marketers to link deep within individual applications on mobile, a great example of how you should really be thinking about optimizing your mobile experience.
Ultimately, what you’re trying to do is to make the experience of your store as good on a 5” screen as on a 15” screen. That’s definitely a challenge, but it’s doable. Companies have done it, and more will figure out how every day.
In this race, you’d rather be Amazon than Borders.