Good data analysis is the search for cause: attempting to uncover why something happened. Traffic to the website is low—why? Our email click through rate is improving—is it because we recently redesigned our email template, or because we’re focusing on more direct calls to action? The best way to find these answers is to rely on the same approach that scientists have used for centuries—experimentation.
As technologist Scott Brinker advises: “Experimentation is the gold standard of causation.” A thoughtfully crafted experiment allows you to zero in on the variables that influence your data. Instead of retroactively analyzing your data, you isolate your assumption and design an experiment that will allow you to test it. These tests start with a hypothesis.
State your hypothesis
A hypothesis is a predictive statement, not an open-ended question. A good A/B testing ahypothesis will invite you, through research, to identify a potential solution. Let’s look an example of an experiment that RJMetrics ran on their website.
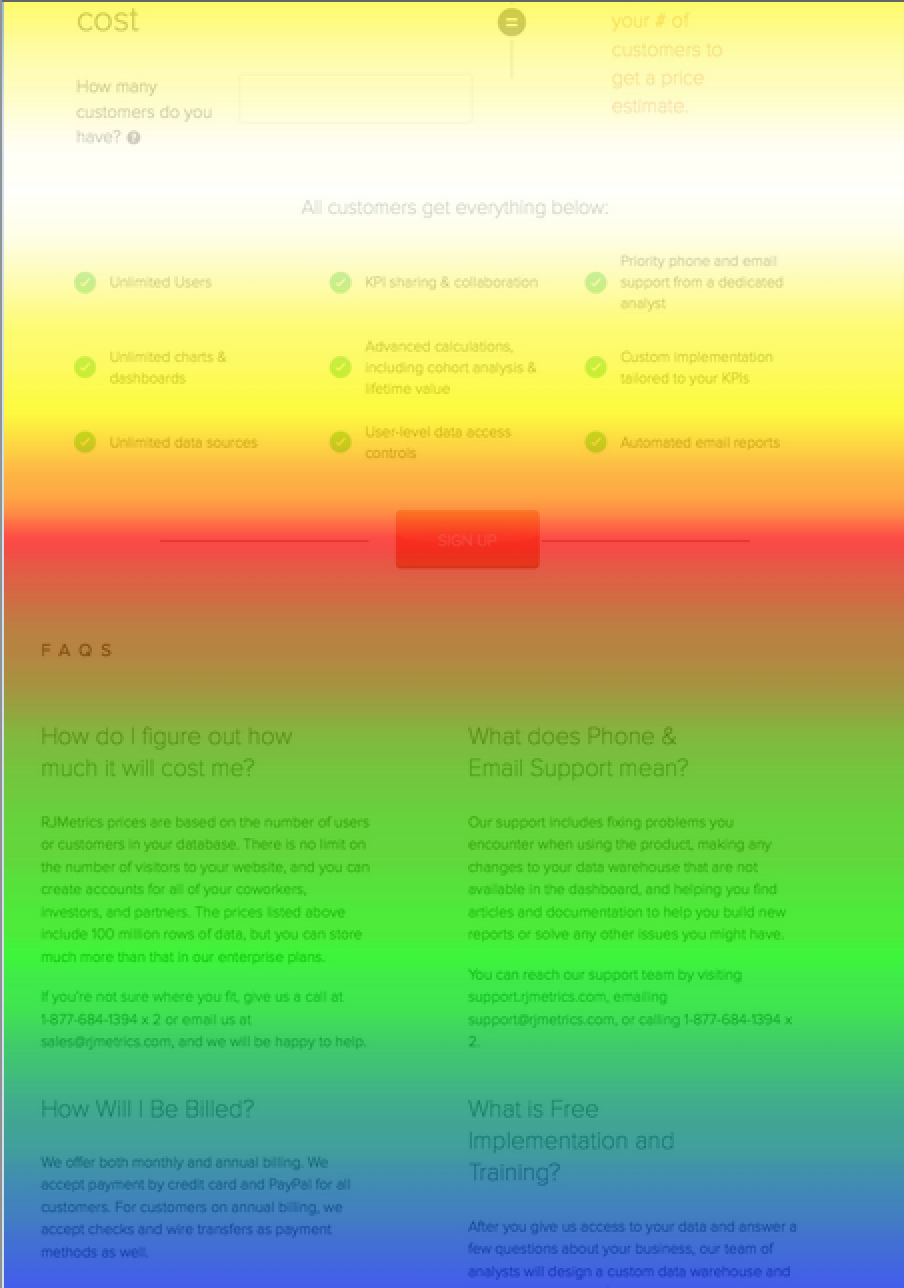
In a pricing page experiment, RJMetrics’ hypothesis was informed by qualitative data on how visitors were interacting with the web page. They used Crazy Egg to produce a heat map that showed high and low-activity parts of the page:
Stephanie Liu, front-end developer at RJMetrics and Optimizely’s Testing Hero of the Year, crafted the following hypothesis:
My hypothesis was that moving the button into the white hot scroll map area would cause the design to have a higher conversion rate as compared to the original pricing page. More people would pay attention to the button simply because their eyes would be lingering there longer.
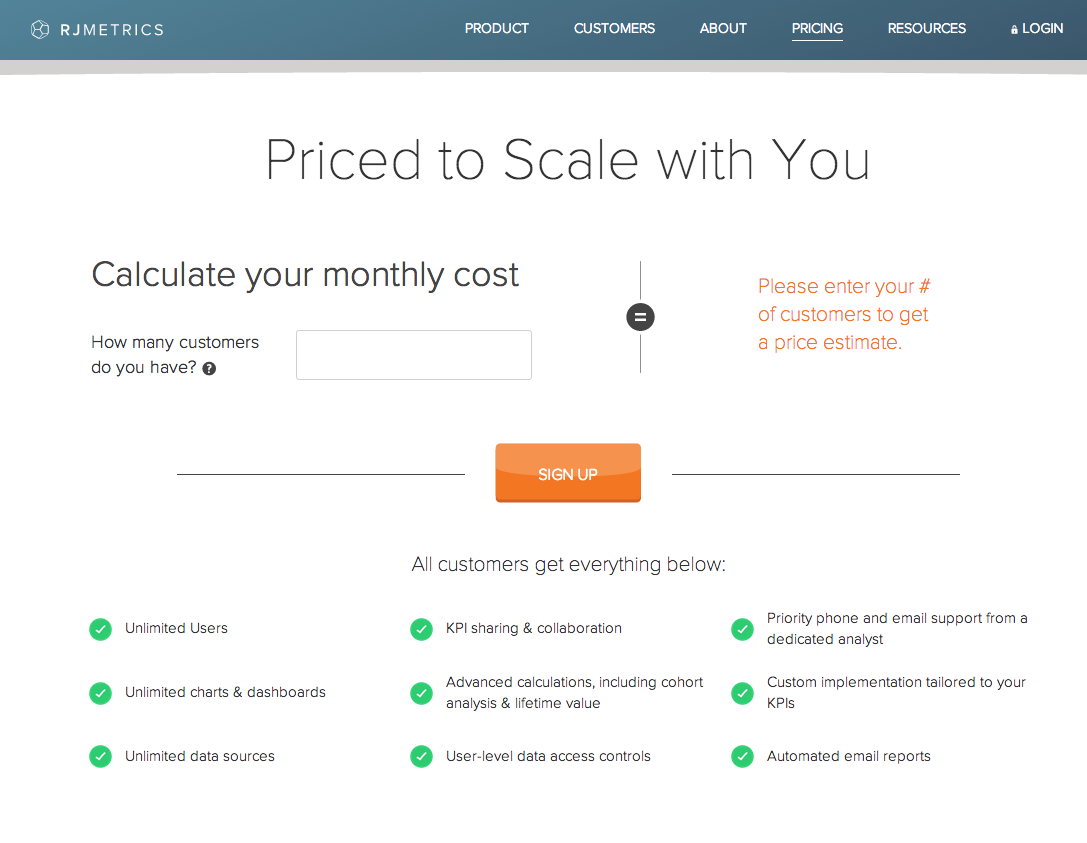
Here’s her original version:
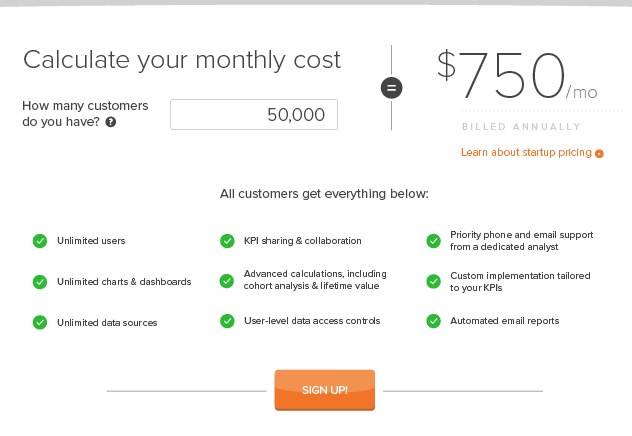
Here’s her variation:
Stephanie’s experiment proved her hypothesis to be correct, and her improved pricing page resulted in a 310% improvement in conversions on the pricing page—a staggering win, due to diligent use of data and a well-formed hypothesis.
The Inspectable Elements of a Hypothesis
Let’s boil down a hypothesis to its individual components. Data fits into the hypothesis framework in a number of areas.
“If _____[Variable] _____, then _____[Result]_____ [Rationale].”
The Variable: A website element that can be modified, added, or taken away to produce a desired outcome.
Use data to isolate a variable on your website that will have an impact on your performance goals. Will you test a call to action, visual media, messaging, forms, or other functionality? Website analytics can help to zero in on low-performing pages in your website funnels.
Result: The predicted outcome. (More email sign-ups, clicks on a call to action, or another KPI or metric you are trying to affect.)
Use data here to determine what you’re hoping to accomplish. How large is the improvement that you’re hoping for? What is your baseline that you’ll measure against? How much traffic will you need to run an A/B test?
Rationale: Demonstrate that you have informed your hypothesis with research: what do you know about your visitors from your qualitative and quantitative research that indicates your hypothesis is correct?
Use data here to inform your prediction: quantitative insights can be very helpful in formulating the “why.” Your understanding of your customer’s intent and frustration can be enhanced with an array of tools like surveys, heat maps (as seen above), and user testing to determine how visitors interact with your website or product.
Strengthening your Hypothesis
Not all hypotheses are created equal. To ensure that your hypothesis is well-composed and actionable, use a few of the following tips. Here are some examples of strong and weak hypotheses:
| Strong Hypothesis | Weak Hypothesis |
|---|---|
| “If the call-to-action text is changed to “Complete My Order,” the conversion rates in the checkout will increase, because the copy is more specific and personalized.” This hypothesis is strong because of its specific variable to modify (CTA text) and rationale, which indicates an understanding of the audience for the page. | “If the call-to-action is shorter, the conversion rate will increase.” This hypothesis is weak because it is very general, and does not include a rationale for why the proposed change would produce an improvement. What would be learned if this hypothesie |
| “If the navigation is removed from checkout pages, the conversion rate on each step will increase because our website analytics shows portions of our traffic drop out of the funnel by clicking on these links.”This hypothesis is strong because it is supported by website analytics data that highlight a high-impact opportunity for streamlining the checkout process. | “If the checkout funnel is shortened to fewer pages, the checkout completion rate will increase.” This hypothesis is weak because it is based on the assumption that a shorter process is better, but does not include any qualitative or quantitative data to support the prediction. |
A strong hypothesis is:
Testable. Can you take action on the statement and test it? Keep your predictions within the scope of what can be acted upon. Avoid pulling multiple variables into the statement—a more complex hypothesis makes causation more difficult to detect. For instance, don’t change copy on multiple parts of a landing page simultaneously.
A learning opportunity, regardless of outcome. Not every experiment produces an increase in performance, even with a strong hypothesis. Everything you learn through testing is a win, even if all it does is inform future hypotheses.
That brings us to our next tips for using hypotheses:
Hypothesize for every outcome. One of our solutions partners, Blue Acorn, mentioned a hypothesis best practice that we think is fantastic. To ensure that every experiment is a learning opportunity, think one step ahead of your experiment. What would you learn if your hypothesis is proven correct or incorrect in the case of a variation winning, losing, or a draw?
Build data into your rationale. You should never be testing just for the sake of testing. Every visitor to your website is a learning opportunity, this is a valuable resource that shouldn’t be wasted. RJMetrics recently wrote a tutorial on how to use data to choose and prioritize your tests, you can check it on the Optimizely blog.
Map your experiment outcomes to a high-level goal. If you’re doing a good job choosing tests based on data and prioritizing them for impact, then this step should be easy. You want to make sure that the experiment will produce a meaningful result that helps grow your business. What are your company-wide goals and KPIs? Increasing order value, building a revenue stream from existing customers, or building your brand on social media? If your experiments and hypotheses are oriented towards improving these metrics, you’ll be able to focus your team on delving into your data and building out many strong experiments.
Document your hypotheses. Many website optimization experts document all of the experiments they run on their websites and products. This habit helps to ensure that historical hypotheses serve as a reference for future experiments, and provide a forum for documenting and sharing the context for all tests, past, present, and future.
Now, Build Your Own
A hypothesis is a requirement for anyone running A/B tests and experiments on their website. When you build your own hypotheses, remember to:
- Clearly define the problem you’re trying to solve, or metric you’re looking to improve
- Bring quantitative and qualitative data into the hypothesis
- Test the hypothesis to strengthen and ensure it is actionable
- Look at every experiment as a learning opportunity
If you need some extra help check out our ebook, Building your Company’s Data DNA for more tips on how to build data-driven hypotheses.