This blog post is a recap of a recent webinar presented by Lori Gauthier, Ph.D., Director of Marketing at Zendesk; and Peter Marinari, Director of Customer Success at RJMetrics.
Here’s a scary fact, only 32% of ecommerce customers make a second purchase. And it’s not much better for SaaS companies who experience between 6-13% Annual Gross Dollar Churn.
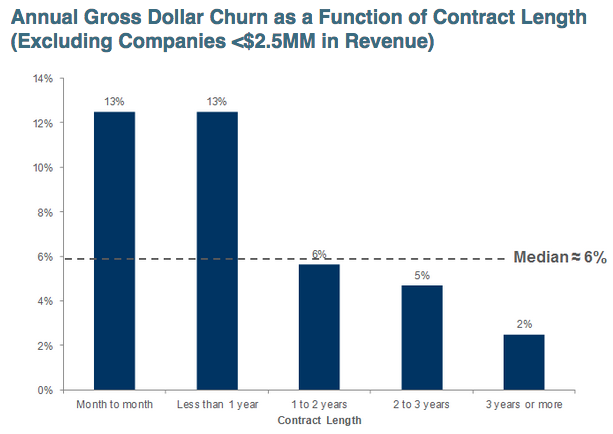
These numbers are unsettling for anyone trying to grow a company. Now, think about this: The most common reason customers leave is because they believe a company doesn’t care about them. That’s why 68% of customers stop doing business with a company! This number is unsettling for two reasons. First, it’s very big. Second, it’s not a very well-defined bucket.
What causes a customer to feel like a company doesn’t care about them? You know you care about your customers, that’s why you hired a customer support team! It’s why you’re building a great product! It’s frustrating to not know what’s behind this big number.
Of course the specific drivers behind that statistic are different for every company. It might be a the lack of training resources for customers, or website copy that doesn’t set the right expectations. Whatever the reason, figuring out the “why?” behind that number can help you drastically improve your customer retention.
Intro to NPS
Customer surveys are one of the best ways to get insight into what’s making your customers feel uncared for. This feedback comes in a variety of shapes and sizes:
- Customer effort surveys will measure how hard a customer had to work to accomplish a specific task (i.e., placing an order, returning an item, resolving an issue)
- Customer satisfaction surveys will measure how satisfied a customer is after a given transaction
- Customer loyalty surveys will give you a higher-level look at how likely a customer is to come back
Net Promoter Score (NPS) is one of the most common ways to measure customer loyalty. It is measured via a single question, paired with room for open-ended comments:
- How likely are you to recommend us to someone you know?
- You rated us a X, will you share why?
This is a quick, easy way to find out exactly how your customers feel about you. But like every data tool, you need to know how to use it. Let’s jump in.
Analyzing the NPS number
The answers to the first question, “How likely are you to recommend us to someone you know?” buckets users into three groups: Detractors, Passives, and Promoters.
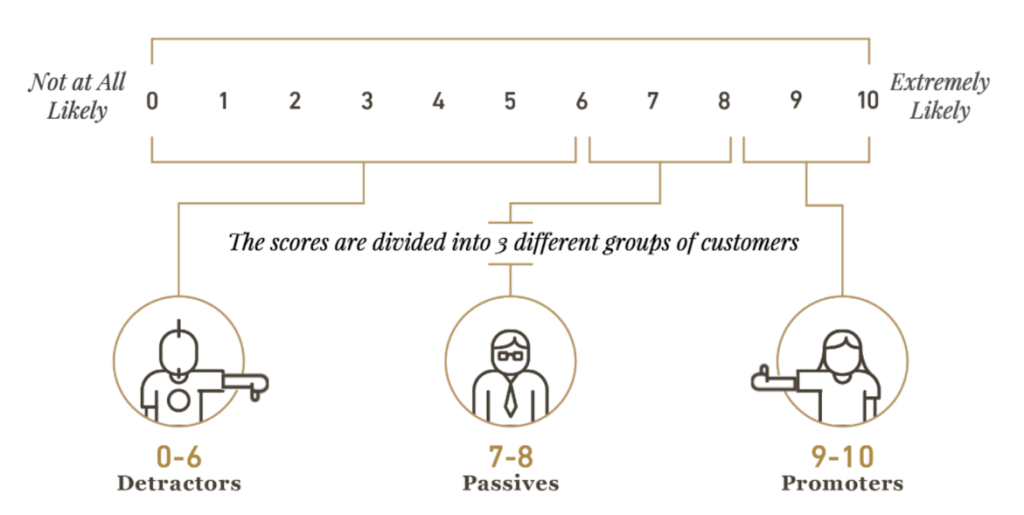
The NPS score is then calculated by simply subtracting the percentage of detractors from the percentage of Promoters; Passives are excluded. So if you have 40% Promoters and 33% Detractors, your NPS score is 7. This is a very high-level metric, so how do you turn it into something your team can use to take smarter actions?
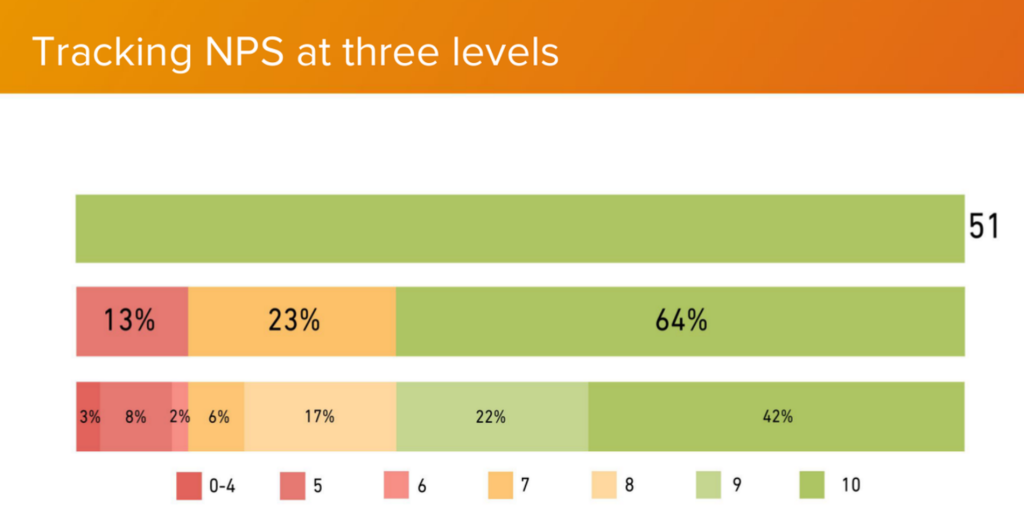
- Track NPS at three levels
The first level is the one we just looked at, that very top-level metric. The second level looks at the % of people that fall into each of your three buckets. The third level looks at the % of people who fall into each number segment. For example, you’ll want to know how many 10’s you have, those people love you.
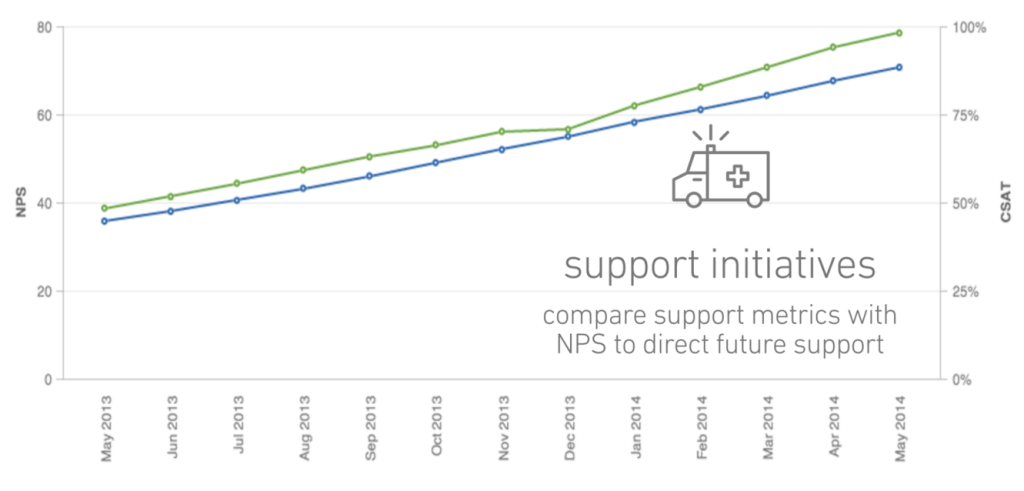
- Track NPS over time
This will tell you whether you’re getting better at rooting out the issues that are causing your customers to leave. One important consideration: NPS has a random measurement error of about five points. This means that if you have an NPS of 57, a change the next quarter that falls in the range of 52-63 isn’t a cause for concern. - Identify at-risk customer segments
You can use this data to look at how NPS scores vary by customer segments like gender, industry, revenue, or even product line’s shopped; anything that’s meaningful for your business. This can help identify your ideal customer or customer segments that are particularly at-risk. - Correlate NPS with other scores that matter
Optimizing for NPS isn’t an end-goal. Rather, NPS is a metric that, if moved in the right direction, will have positive impacts on your business KPIs. To show this, you’ll want to track NPS alongside metrics like revenue, repeat purchase rate, or customer satisfaction.
Analyzing the comments
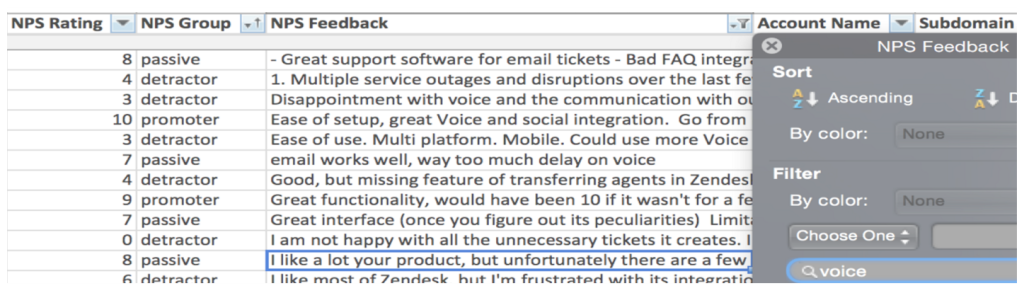
The text portion of a customer’s NPS response can hold a wealth of insight into the “why?” behind your scores. The easiest way to get started is to fire up Excel or a Google spreadsheet, dump in the text comments, and get to work. Search for specific terms: product features, or words like “support”, “crash”, or “fast.”
Text analysis is also great for identifying common themes. A good rule of thumb here is that if 10% of the comments are related to a particular theme, it’s time to start addressing that issue. A smaller percentage than that and you’ll likely end up wasting resources to solve a problem that impacts only a very small group of customers.
These are the basics, but there are so many more ways to squeeze value out of your open-ended comments. For example, once you have your themes bucketed, look at the NPS score of users mentioning those themes, like this:
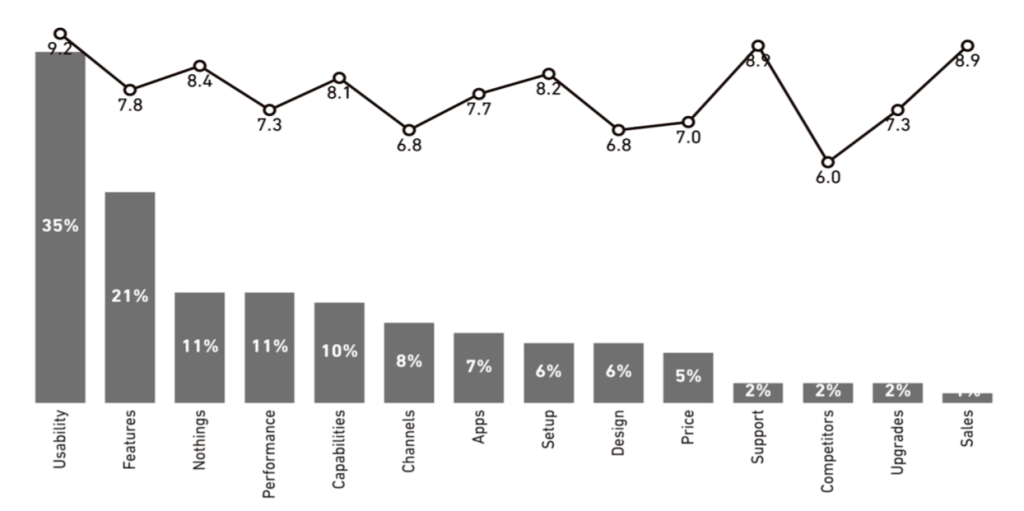
You can see here that the people talking about your competition are giving you the lowest NPS rating. Why? Who are the competitors they’re talking about? Go back and read the comments – what are they saying about your competition that they might expect from you?
This is powerful stuff, but with great power comes great responsibility. Remember that customers are good at telling you what they’re feeling or what they think the problem is, but that might not necessarily be the problem. Customers might call something a product failure, but really it’s an opportunity to advise customers, or train them, or even upsell them to a product that might be a better fit for their needs. Don’t underestimate just how valuable humans are in helping you make sense of customer feedback.
Keep learning
This blog post is a summary of a 45-minute presentation that was a summary of a very big (and fascinating) topic. There’s so much more to dig into. If you’d like to keep learning, you can watch the video from the presentation below, flip through the slides, or check out the following resources to get you on the right track.
From Lori Gauthier, Ph.D:
- Register for Relate, and join Lori for a hands-on survey workshop
- 5 Ways to Better Connect with Customers Using NPS Data
- The Human Approach to Building Better Customer Satisfaction Surveys
From RJMetrics: