Businesses with both an online and a brick-and-mortar presence know the importance of analyzing customer behavior between these two channels. A multitude of questions can arise from these omni-channel business models, such as “Are online customers more valuable than in-store customers?”, or “Are customers acquired via in-store more loyal than those acquired online?” In this article, I’ll describe three simple analyses that will show the insights gained from analyzing customer behavior between channels.
Customer acquisitions by channel
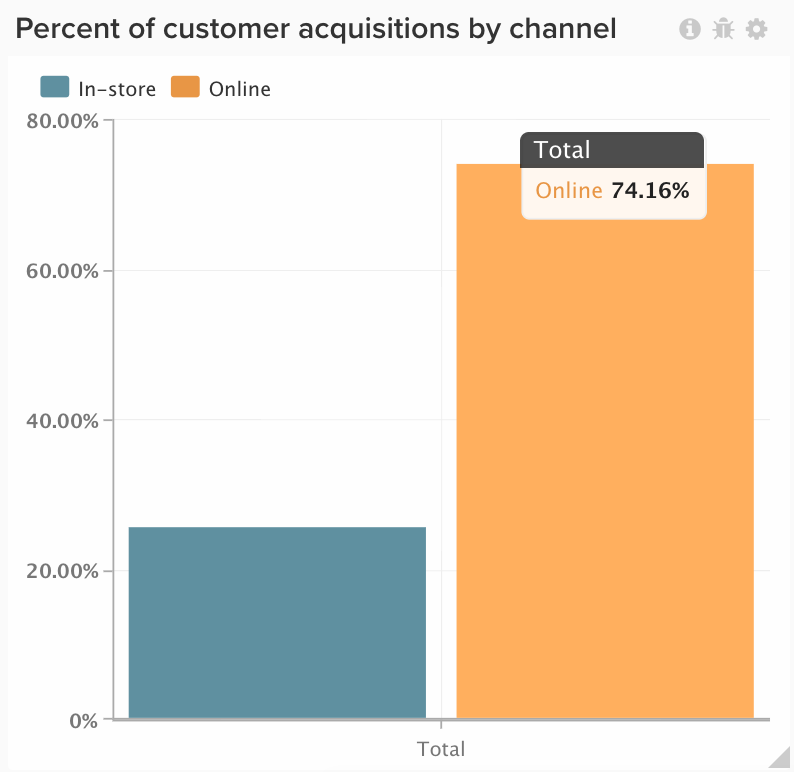
Identifying the distribution of customer acquisitions across channels is one of the most basic questions that omni-channel businesses should have a clear understanding of. In the example below, you can see that the majority of this business’s customers were acquired online. This information could help improve or reaffirm current marketing strategies for acquiring customers there.
Lifetime revenue by channel
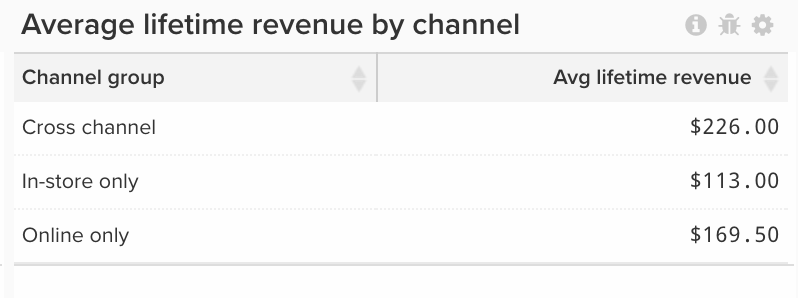
Analyzing the distribution of customer acquisitions only tells a small part of the story, though. If we dive further into these customers’ behaviors, the average lifetime revenue of these customer segments can be enlightening. The average lifetime revenue can be segmented by the channel of acquisition, or it can be segmented by the channels shopped with each purchase. For example, customers who only ever shopped in-store can be segmented from those who only ever shopped online, and customers who have shopped both online and in-store can be analyzed separately. In the report below, you can see that cross-channel customers (those who have shopped online and in-store) have the highest lifetime revenue of the three groups. Thus, encouraging customers to purchase online and in-store will increase the spend from these customers.
Repeat order probability by channel
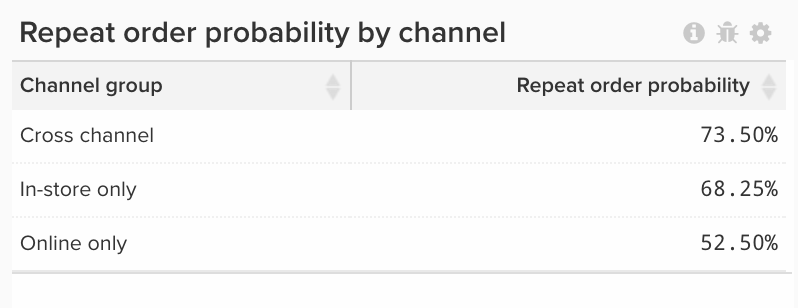
Finally, an extremely powerful data point for omni-channel businesses to be aware of is the repeat order probability for these customer segments. This report shows that for customers who have purchased both online and in-store, there is a 73.5% probability that they will make another purchase. In this example, we notice that cross-channel customers are more loyal than the other customers.
If you operate a business that sells in multiple channels, having knowledge of these three measures is table stakes for acquiring and retaining customers. At RJMetrics, we combine your data sources and visualize these trends in a way that helps you easily answer these questions and more — including average order value, returns, number of orders, etc. Knowing your customers can help you make data-driven decisions. If you’re interested in learning more — sign up today!