If you’re reading this, you’re probably pretty familiar with RJMetrics. Maybe you’re a power user who uses RJ every day, or maybe you just see your key KPIs in an email summary. One way or another, though, you have used the platform to answer mission-critical questions about your business. Here on the analyst team, we are often enlisted to help you answer those questions. We work with hundreds of businesses, across all sorts of industries, and those questions you are using RJ to answer for the first time have very often come across our desk before:
- “How do I track my customer churn?”
- “What is the value of a newly acquired customer?”
- “How well do I manage my inventory stock?”
These questions, and many others, get asked to us all the time; so often that our team knows exactly what reports to build to help you answer these big questions. Because of this, our team got together to standardize the way RJMetrics users can answer these questions. We figured, if we know the best way to help clients find answers — why are we waiting for clients to even ask for help? Why not just publish these sets of reports, and empower our users to make data-driven decisions all on their own? We’re proud of announce the results of these efforts, which we call the RJMetrics Analysis Library.
As of today, there is a new link at the top of the RJMetrics Help Center that will bring you to a catalog of all the analyses we’ve come to regularly recommend to our users. Currently, we have 12 templated dashboards on topics like tracking your progress towards monthly goals, or, analyzing your returned products. These are all topics that dozens of our users have asked about, but didn’t quite know how to get started. We designed this catalog to be a step-by-step outline that will jumpstart the way you think about business intelligence.
A walkthrough
The top of each Analysis Library article is formatted the same way. They start with a brief description of the analysis, and a screenshot of what the resulting dashboard will look like. Most of the analyses will involve a few advanced calculated columns that must be created by an analyst on our team, so we streamlined that process. If an analysis needs some work done by our team, there will be a paragraph at the end of the intro that will instruct to submit a support ticket with the name of the analysis, and we will do our part on the back-end.
Getting started
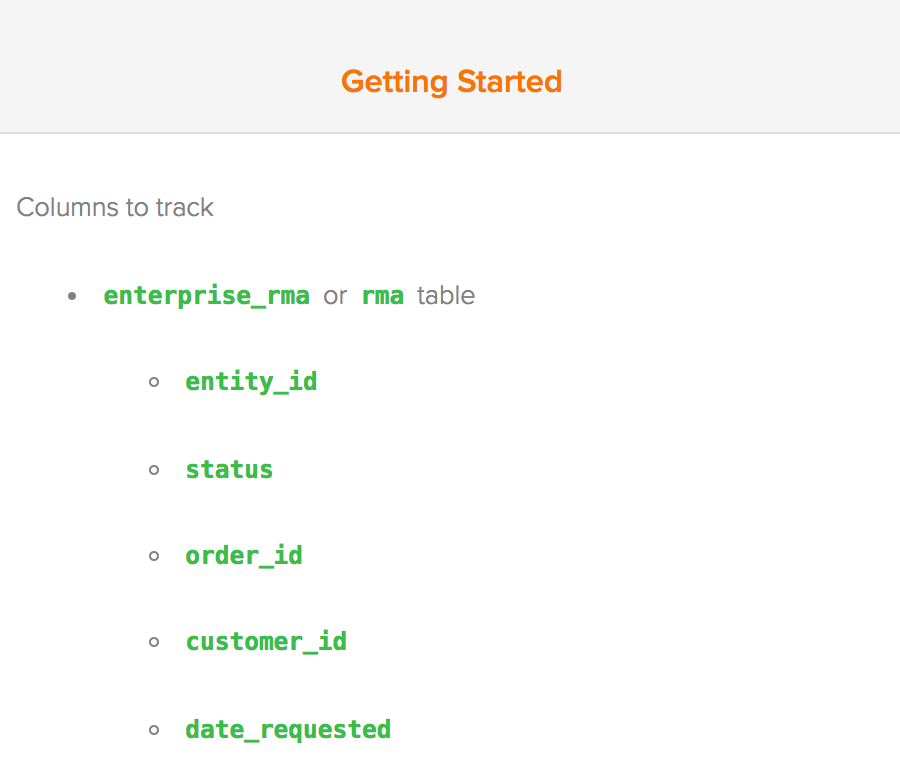
After the intro, each article is organized as a set of drop-down field, the first of which will usually be Getting Started. This section will have all the fields you will need to sync in your RJMetrics data warehouse, as well as any filter sets you will need to create. Some analyses are based on specific integrations, like Zendesk or Desk.com, so you can check this section to make sure you have the right data in your data warehouse to perform the analysis.
As a Magento company, all articles are written using the Magento 1.x and 2.x schema — but that doesn’t mean you need to have Magento schema to perform the analyses. A large portion of our analyses are based around a customers, orders, and line items table, which are present in most schemas. If you are having trouble with any of the articles because you use a different schema, feel free to reach out to support@rjmetrics.com for a second look.
Calculated columns
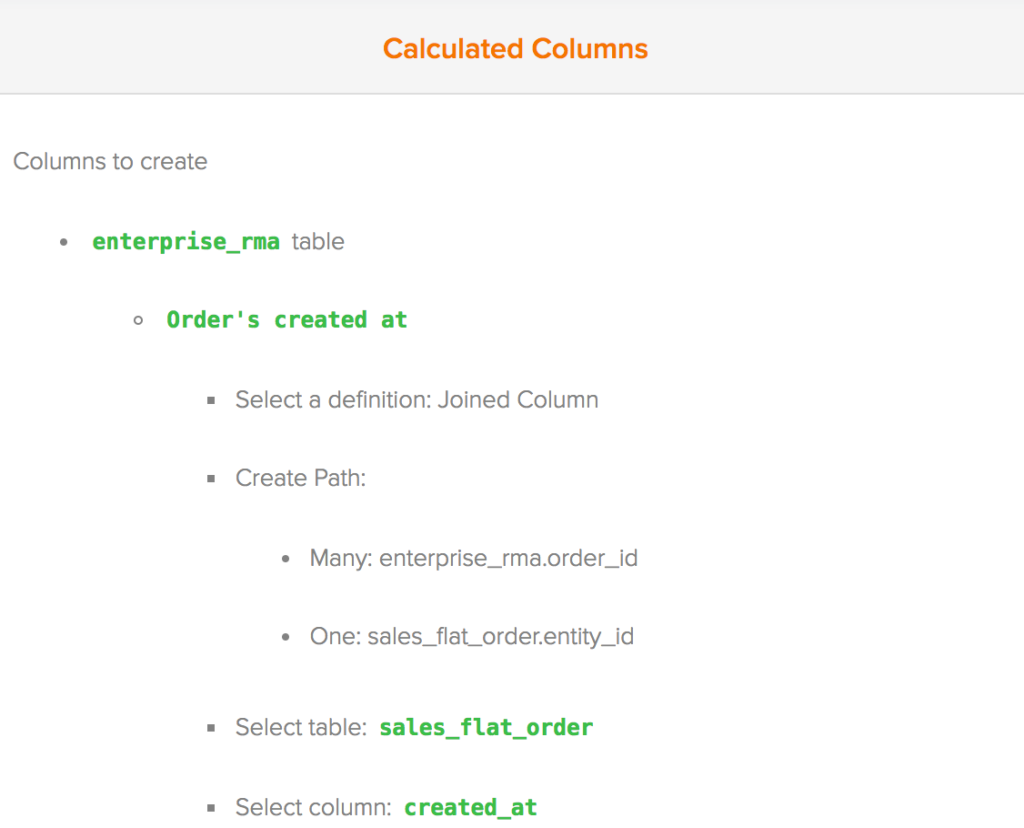
This section will have all the columns you need to create to perform the analyses organized by the table. Any column that can be created by an end-user, and how to do so, will be detailed in this section. Any advanced calculations will also be listed in this section, but will be created by an analyst on our team as part of the support ticket you can open.
Metrics
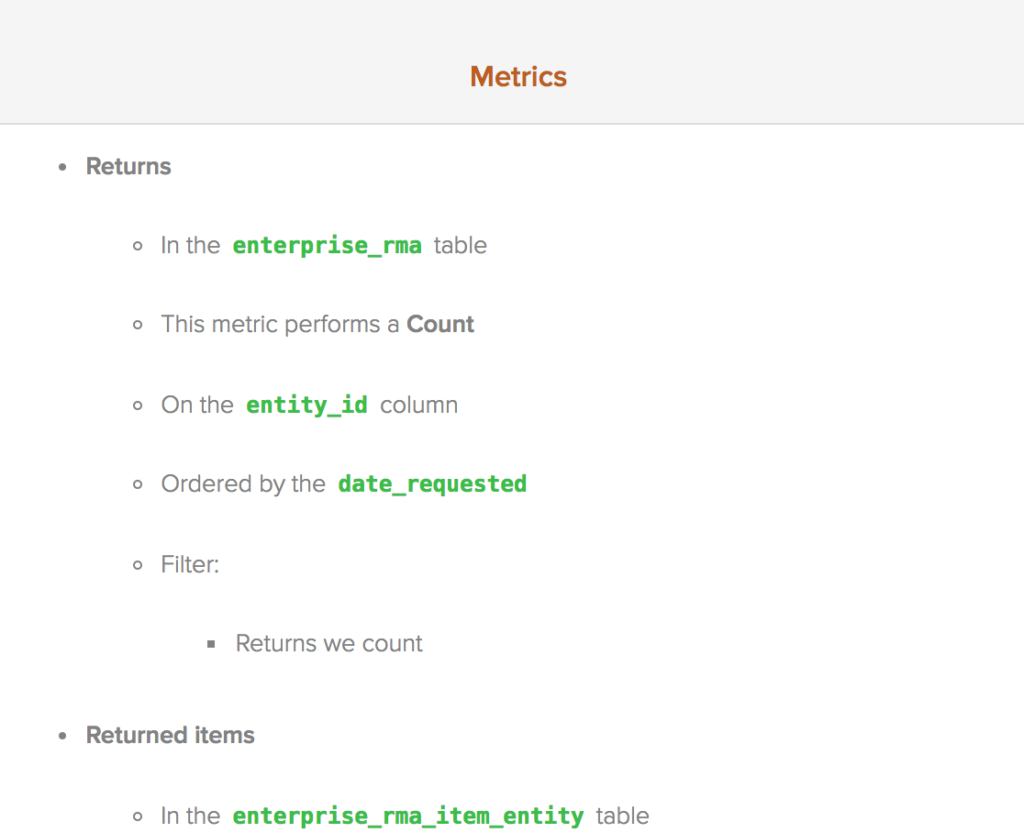
Once you’ve created all the calculated columns and received confirmation that any calculated columns have been added to your tables, it is time to create some metrics. This section has a description of the steps for creating each metric you will need to move on to the Reports section.
Reports
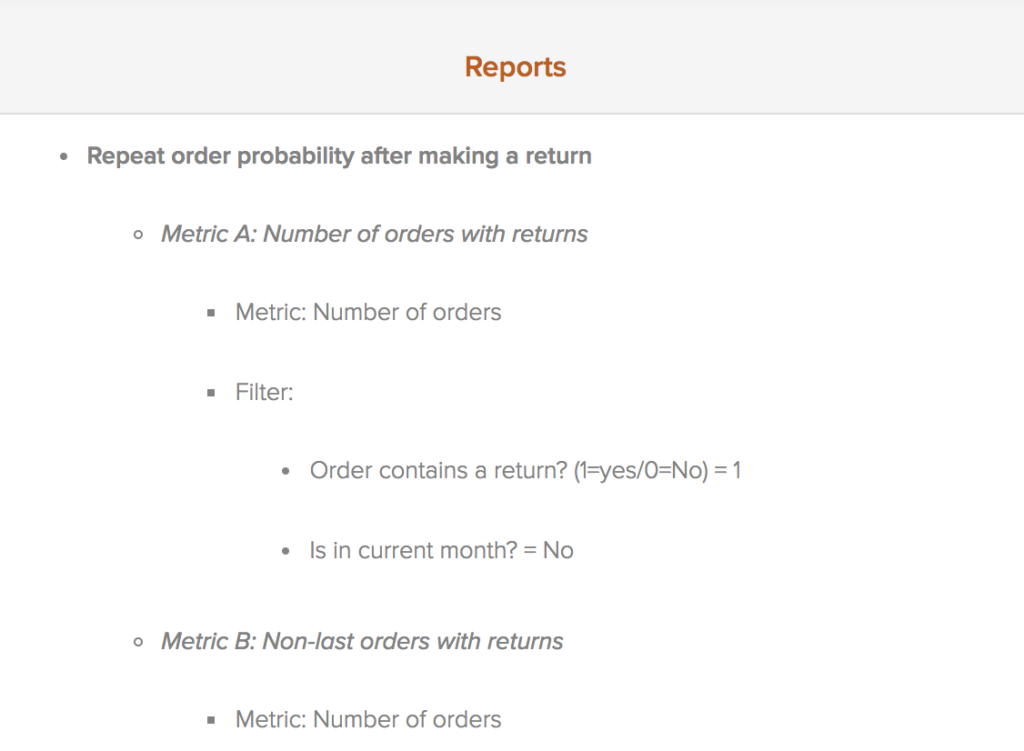
This is the bread and butter of the Analysis Library — the reports in your dashboard. Now that you have all the necessary columns and metrics, you’re ready to dig into the data and find some answers. Depending on what article you’re following along with, this section will have step-by-step instructions for anywhere from 2 to 12 reports.
These reports come from the combined experiences of our analyst team, and are a great starting point for any user interested in answering a burning question about their business. These reports are a great way to get started, but that doesn’t mean you have to stop there. You can take all the liberties you want with these reports, as well — adding additional metrics or filters as you see fit.
New additions
What if there is an analysis you had in mind that isn’t listed in the Analysis Library? Well, we want to hear about it! We plan on it growing and changing this offering as we discover new analyses and best practices.
Do you have a good idea for an analysis, or a dashboard you are particularly proud of? It would make a fine addition to our collection. Send us suggestions for new Analysis Library articles at support@rjmetrics.com.