Today, we’re releasing a brand new product into open beta called RJMetrics Pipeline. Pipeline streams your data, from wherever it sits, to Amazon Redshift, so that you can answer the most important questions about your business. Sync data from MySQL, Salesforce, Stripe, Facebook Ads, Adwords, and more.
Pipeline is completely self-serve, and it takes about 5 minutes to configure your first data sync. Pricing is based on event volume, and the first 5 million events a month are completely free, forever. Try it out and let us know what you think.
We Know Pipelines
From the earliest days of RJMetrics, we’ve found success by bringing business users closer to their data. This was true in 2010 when we introduced the first version of our CloudBI dashboards, in 2012 when we began expanding our universe of connectors to include SaaS tools and APIs, and even this year when we rolled out functionality allowing our end users to model the data inside their warehouse directly.
Excitingly, as our product has matured, so have our users. More and more, we’re hearing customers ask for access to the raw data behind their dashboards. Companies are getting more sophisticated in their use of data and investing in teams of dedicated analytics professionals. Use cases are multiplying, and the average company’s choices in analytical tools are becoming correspondingly diverse. Tools like Looker and Mode are targeting these analysts, and an ever-growing population of data scientists wants to use tools like R and Python to go even deeper.
For the first time, companies can actually work with large data sets without having to deploy heavyweight technology. The release of Amazon Redshift has given analysts the ability to query huge datasets performantly, and it can be spun up easily and cheaply.
We’ve spent months learning from our customers and talking to many other thought leaders in our space, and we’ve learned exactly what we needed to know: the data pipeline problem is real, the existing solutions are not good, and our technology and expertise make us uniquely positioned to close the gap.
Data Infrastructure for the Modern Business
I’m incredibly proud of the product that we’re launching today, and I’m excited about its future. RJMetrics Pipeline is exactly the tool that companies need to tackle the data consolidation challenge. Here’s why:
- Data volume grows as your business grows. Often, companies home-grow a data pipeline that’s suitable for their current data volume, but breaks down at scale. Pipeline will scale with you infinitely.
- Monitoring and error-handling are consistently neglected in home-grown solutions, leading to silent infrastructure failures. Pipeline includes a robust logging and notification system; you will always be notified proactively of any problems.
- APIs change constantly. Pipeline makes sure that data just flows, with no maintenance effort required on your part.
- Setting up an entire infrastructure, with as many integrations as you want, takes minutes and requires zero code.
That last point is especially critical: we want to make the experience of consolidating data accessible to anyone. Here’s what it looks like to set up an integration:
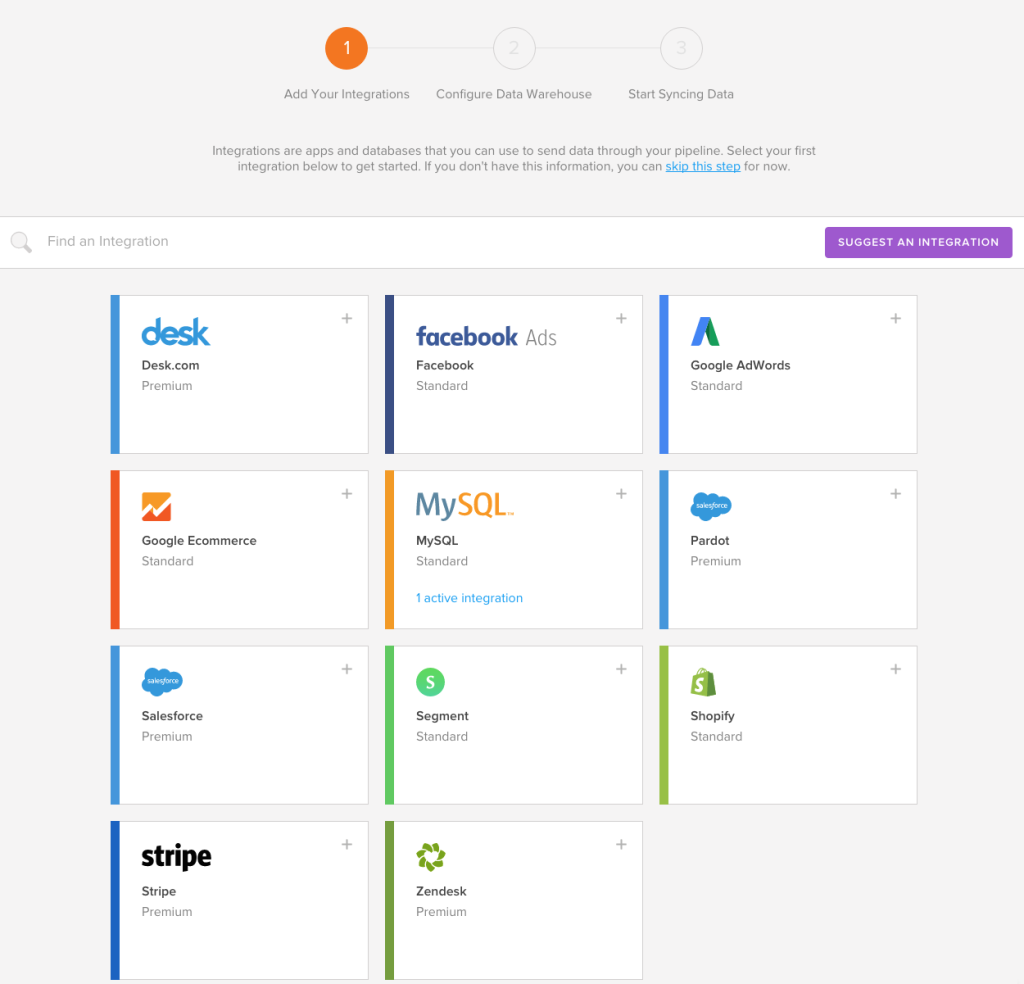
First, select your integration. We currently support MySQL and ten cloud platforms, with more integrations rolling out on the regular. Then, authenticate Pipeline to access your account. For many accounts, this is a simple OAuth—if your browser is already logged in, just give Pipeline permission.
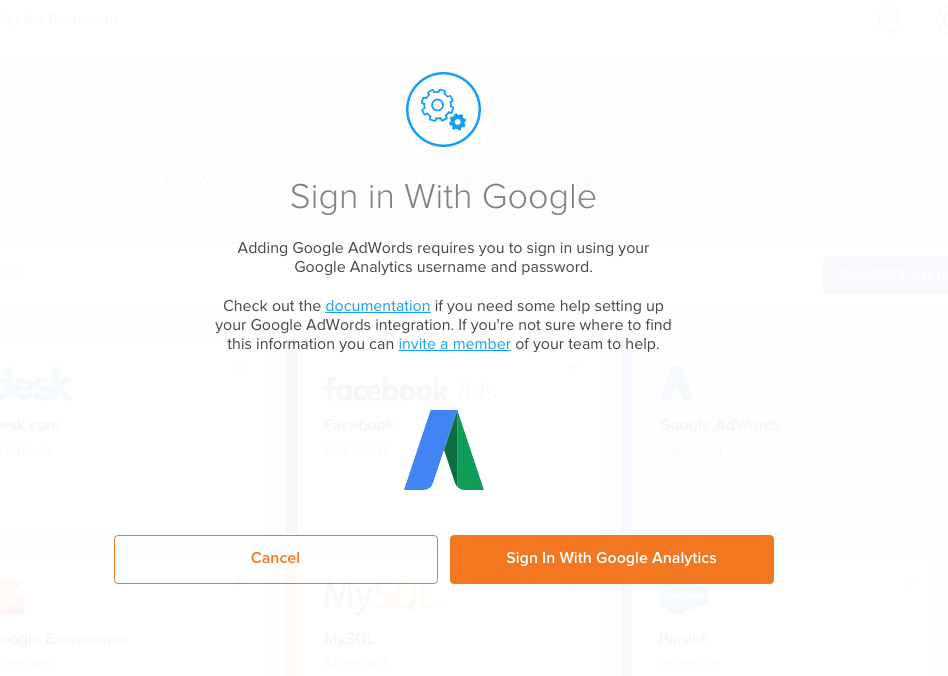
It’s really that easy. Configure multiple integrations, and then your Redshift cluster, and Pipeline will begin syncing your data.
For most integrations, Pipeline will sync all historical data in a given integration upon first connection. This is critical when you have months or years of history stored in your various tools: keeping that historical data is absolutely critical for analysis.
Insights Come from Integration
In order to answer the most important questions about your business, you need visibility into every one of your customer touchpoints. Your website, product, email marketing, support center, and advertising channels all have critical information about your customers’ experiences, and it’s the synthesis of this data that allows you to surface meaningful insights. Having access to all of this data allows you to answer questions like:
- Is my web interstitial driving traffic to my mobile app, and does it pay off with a corresponding conversion rate boost?
- Are particular ad campaigns sending us exactly the wrong kind of customers (high support cost, low ARPU)?
- Did our recent product bug cause any customer churn?
This is the level of insight you need to run (and grow) a data-driven business. Today, we’re giving you access to the data you need to get those insights, and we’re excited to see how you use it.
Sign up today and get started syncing.